How to make Your Scholarly Blog Content Visual


Blog categories
Related Article


For platforms
License original, human-reviewed content at scale.
Human beings are very visual creatures, so it shouldn't be surprising that online content has become so image-focused in recent years. Trends in website design have also put visuals at the top of the priority list with parallax scrolling becoming one of the most preferred design techniques for websites and blogs.In parallax design, the background images on a site scroll at a different speed than the foreground text and images. For some great examples of parallax scrolling used in web design, check out these sites from NASA, Lexus, and Mario Kart Wii.What do each of these website examples have in common? Visuals are the first thing you notice. Truthfully, images are usually the first thing visitors to a website or blog notice whether parallax design is used or not. Our eyes are drawn to images and colors first and we react emotionally to those images long before we read a single word.With that in mind, how can you add visuals to your scholarly blog content? You don't need to invest in a complete blog re-design. Instead, use the five visual content suggestions below to boost the visual impact of your blog posts.
1. Static Images
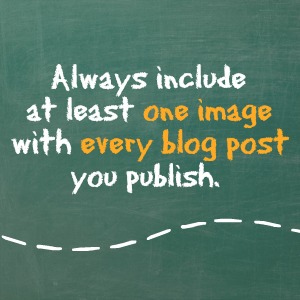
The easiest way to add visuals to your scholarly blog is to include at least one static image with each post that you publish. Insert the image at the beginning of the blog post so it can catch each visitor's attention.This image is also the one that people will include in their social media sharing. Research has found that tweets, Facebook posts, LinkedIn updates, and other social media posts get more views and shares when they include an image than those that don't include an image. That means adding images to your content can increase traffic to your blog.For scholarly blog content, a great way to add static images to your blog posts is by turning quotes or statistics into visuals. Sign up for a free image editing tool like Fotor or PicMonkey and turn a highly shareable quote or statistic from your research into an easily shareable image like the one above.
2. Data Visualizations
Data visualizations come in many shapes and sizes, and they are the best way to add visual content to a scholarly blog. Gather your data, and use it to create a full infographic, mini-infographic that focuses on just a small set of data, or visually appealing charts, graphs, flowcharts, and diagrams.You don't have to hire a graphic designer to create a simple infographic, graph, gant chart, diagram, flowchart, and more. Sign up for free or affordable tools like Visme, Piktochart, or Creately, and you'll be creating your own data visualizations in no time.
3. Timelines
Timelines can communicate a variety of information related to scholarly research. Using Visme, Piktochart, or Creately, you can create static timelines that turn boring sequential or historical data analyses into visually interesting content.
4. Interactive Elements
Interactive infographics, charts, and timelines are very popular these days. Try Dipity, Tiki-Toki, or Timeglider to make interactive timelines. For interactive infographics, try Infogr.am, and for interactive data visualizations, try Dataseed or Tableau Public (the free version of Tableau).
5. Videos
You don't need fancy video production equipment to create videos that enhance your blog content with visuals. Believe it or not, your audience will forgive the fact that your video content isn't professional quality as long as it's actually viewable and contains useful information.Use your iPhone to record yourself talking about your research and upload it to YouTube or Vimeo so it's easy to embed the videos into your blog posts. You can also test tools like Powtoon, Explee or Animoto and make simple videos to explain specific points from your research. Consider investing in a tool like Camtasia Studio to record screencasts or your own PowerPoint presentations with your voice-overs. A free alternative for recording screencasts is Screencast.Bottom-line, if you make your scholarly blog content more visual, your social media sharing will increase as will traffic to your blog. And what scholar doesn't want more people to read their content?Image: Jase Lam licensed CC BY-SA 2.0